01 · Predicts
Every game on the slate, in one screen.
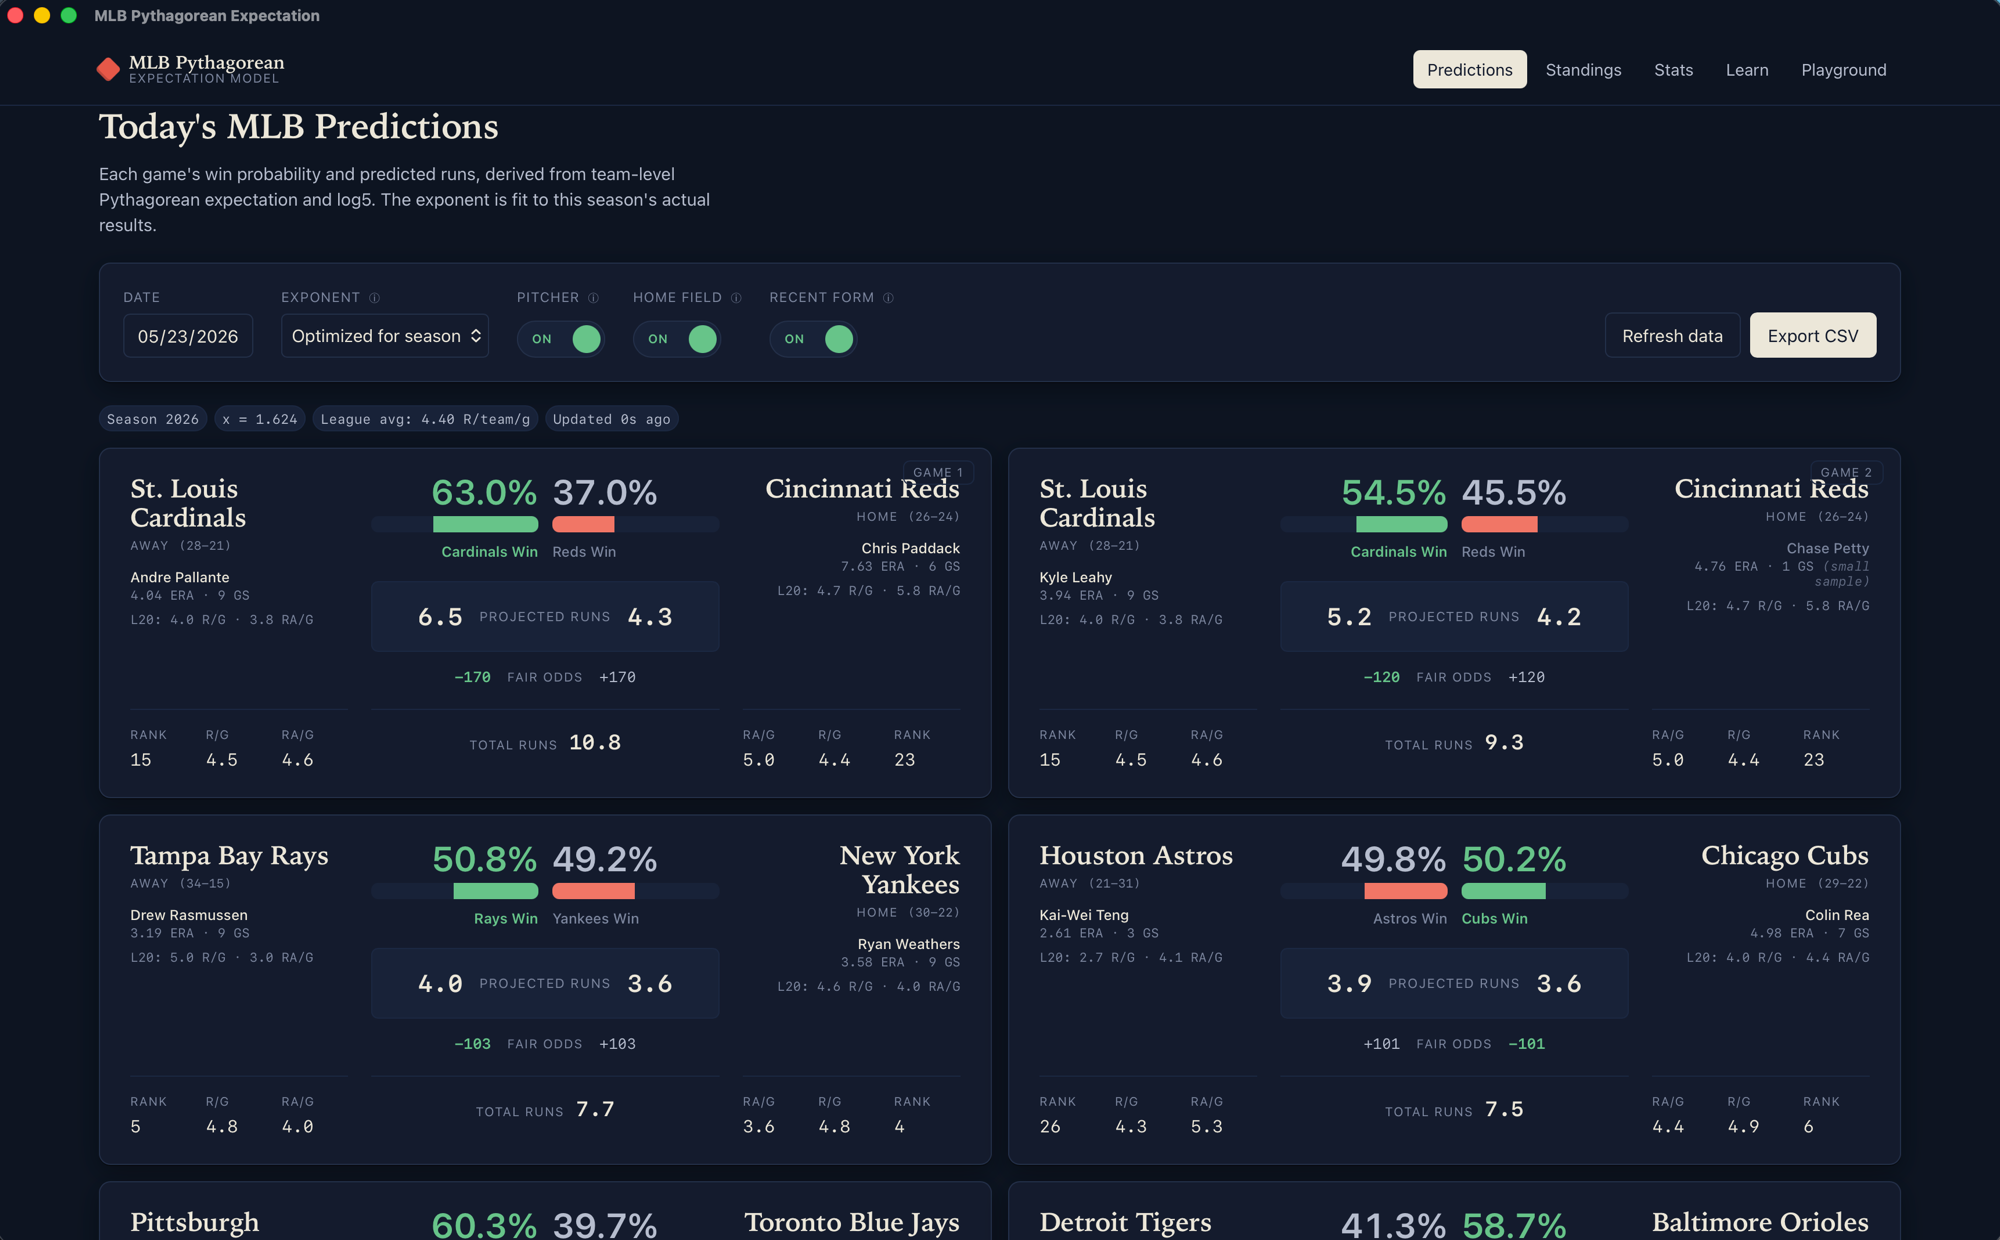
Win probability, projected runs, and fair betting odds for every matchup on a given date. Pulls live from MLB's Stats API. Cards update with the announced starter and each team's last-20-games form.